Exhibited installation · Design with Data · 2026
LOOK DOWN
A physical-digital encounter with the life beneath our feet.
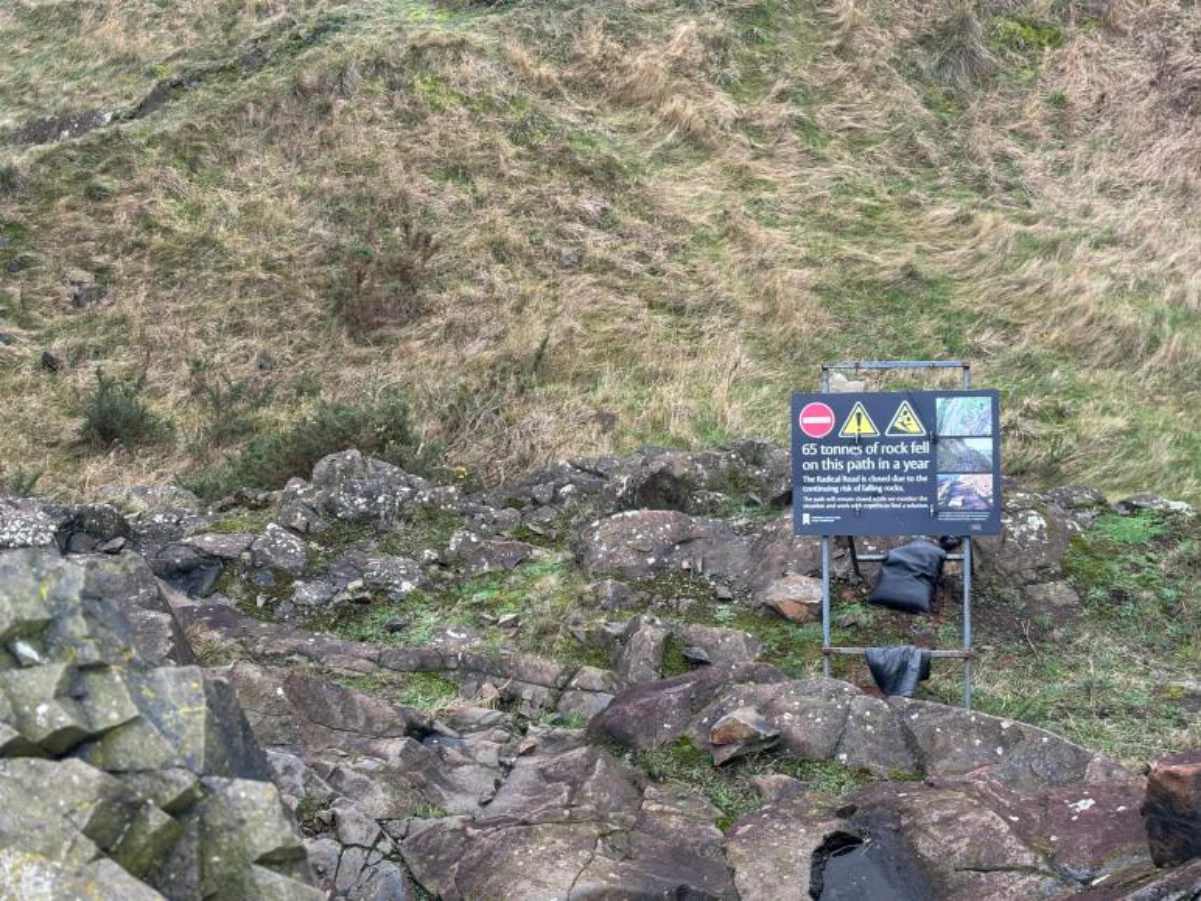
Starting from fieldwork at Salisbury Crags, we explored how underground microbial ecologies could be encountered through movement, material and digital interpretation.
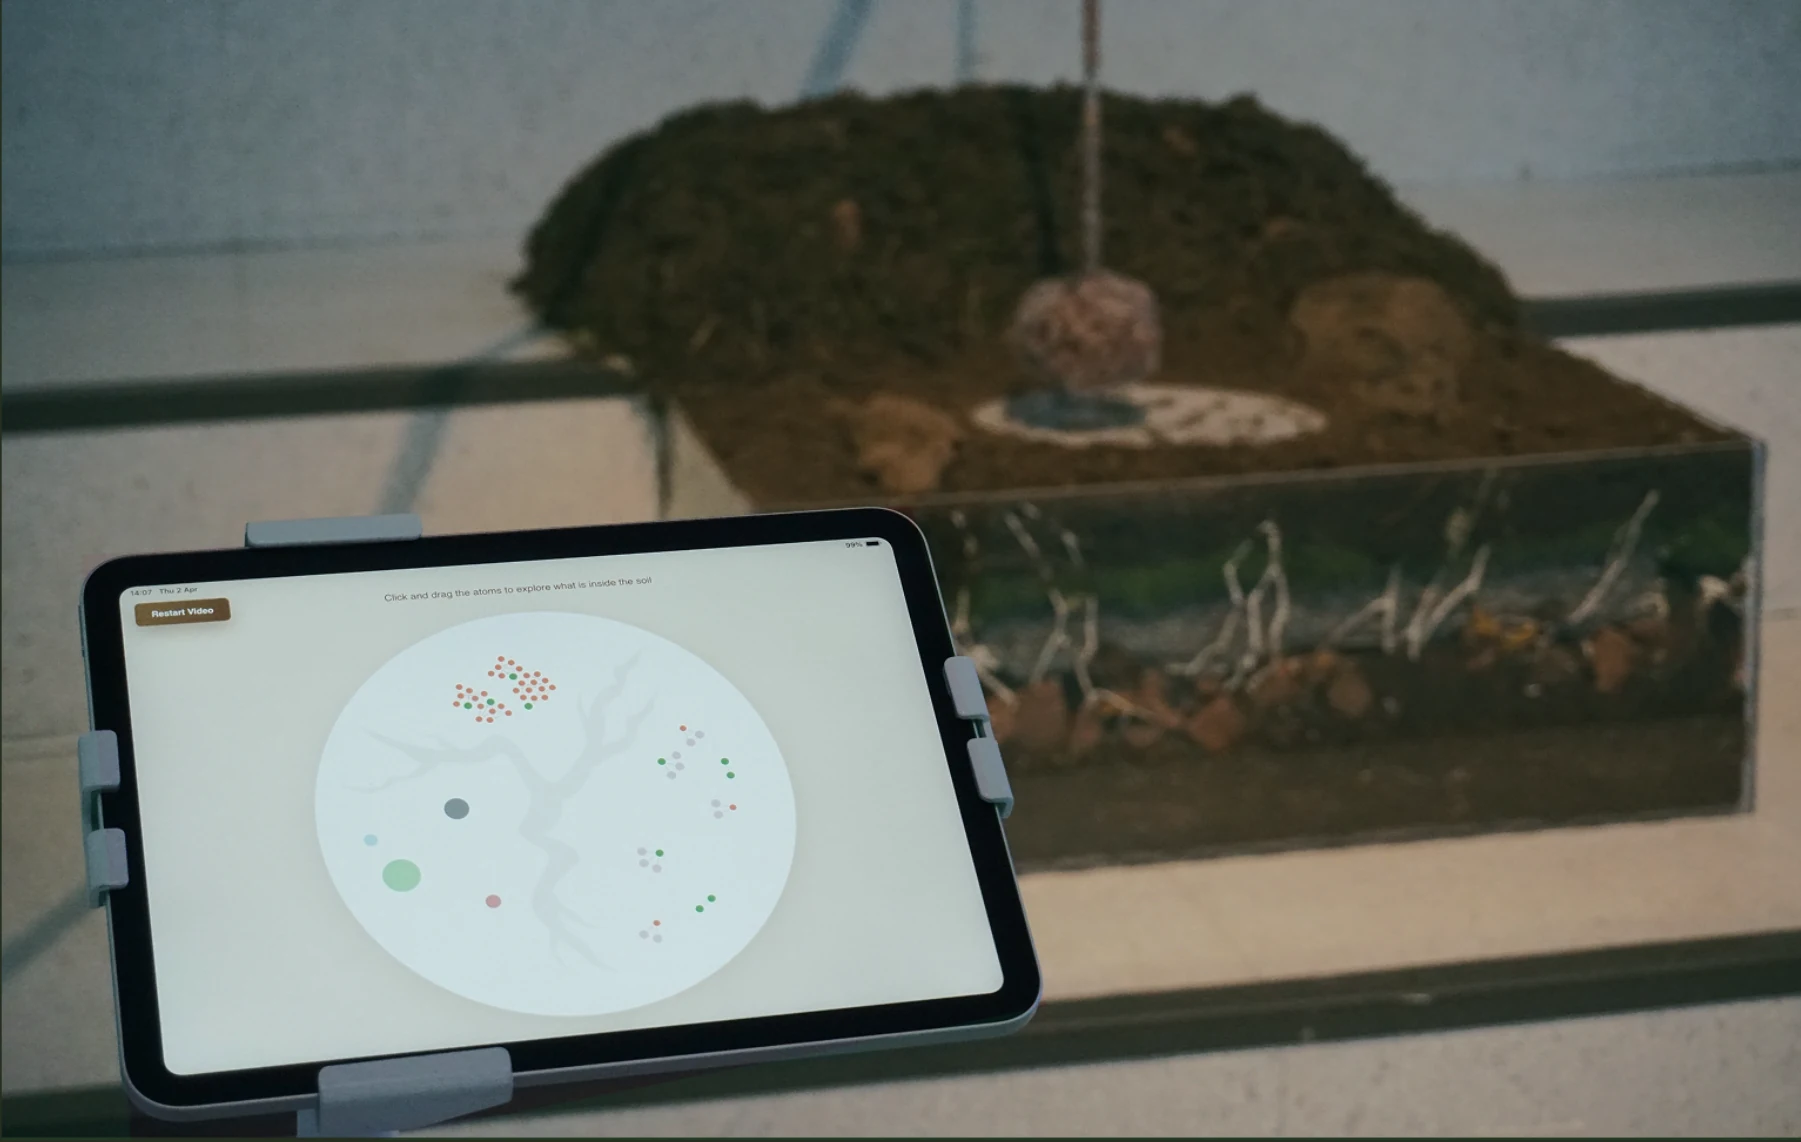
The final installation combines a magnetic pendulum, a layered soil box and a circular interface. Rainfall sets a temporal rhythm; soil comparisons shape the conditions we chose to interpret.
- Context
- MA Design Informatics · University of Edinburgh
- My role
- Collaborative interaction & installation design
- Period
- January–April 2026
- Team
- Five collaborators
- 9
- Locations compared
- 8
- Soil variables
- 1
- Focused mechanism
My contribution within the team
I contributed across several stages within our five-person team. The research, prototyping and making described below were developed collaboratively.
01 / Fieldwork & data
From visible rock to hidden soil ecologies.
We started with what was visible.
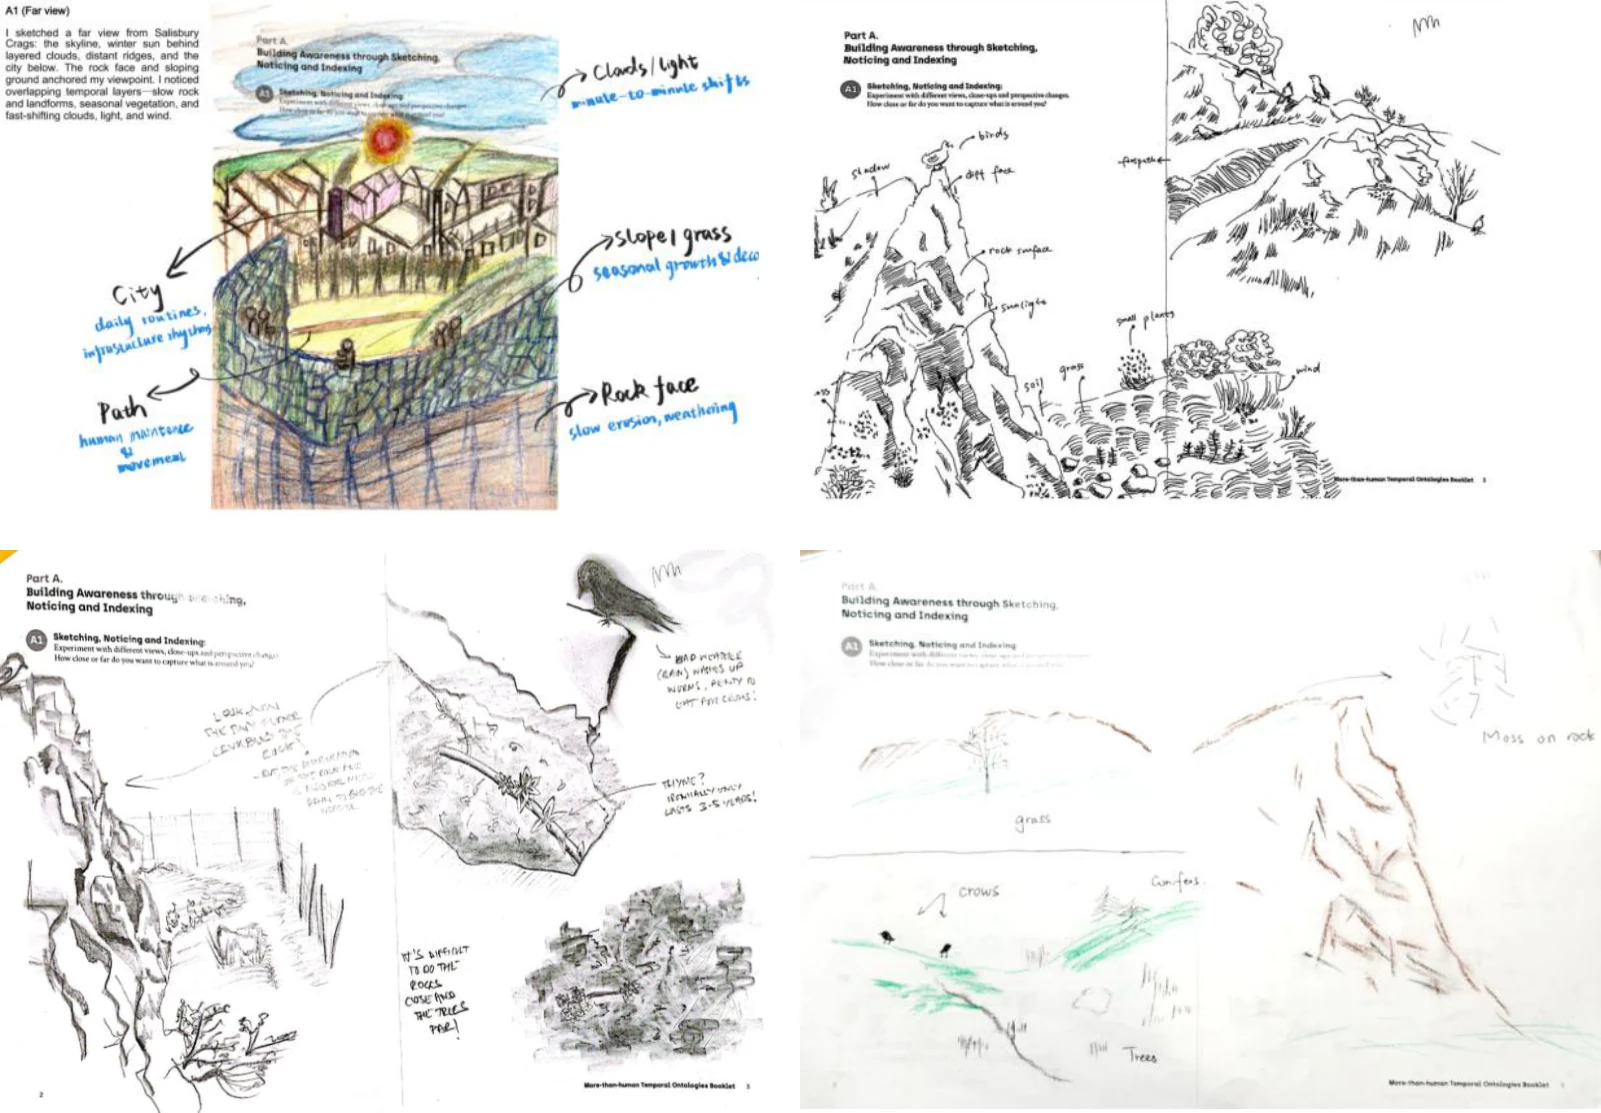
Our fieldwork at Salisbury Crags began with rock faces, paths, fencing and the visible landscape. Returning to our sketches made us notice how much our attention was shaped by scale and visibility.
The project then turned towards the soil beneath the site: an ecological world that was difficult to see, yet central to the landscape we were trying to understand.
Rainfall gives the work a rhythm.
We compared monthly rainfall across nine locations. Edinburgh’s recorded pattern became the temporal input for the installation, with monthly values ranging from 46 to 73 mm.
- 661
- 472
- 573
- 464
- 575
- 566
- 627
- 708
- 719
- 7310
- 6911
- 6312
Soil gives it different conditions.
Eight soil variables helped us compare the selected locations. Rather than displaying every value at once, we explored how differences could inform motion, magnetic zones and an interpretive interface.
These comparisons informed a designed interpretation of soil ecology. The installation was not measuring microbial activity in real time.
Soil comparisons / report Appendix B02 / Finding a focus
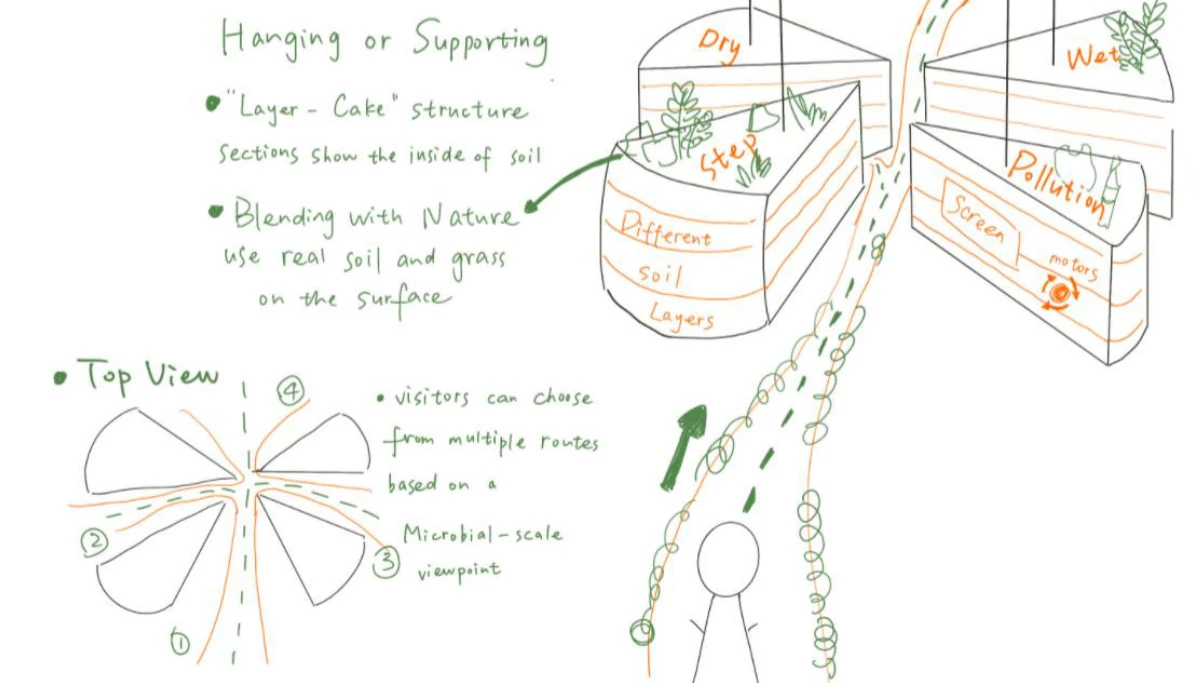
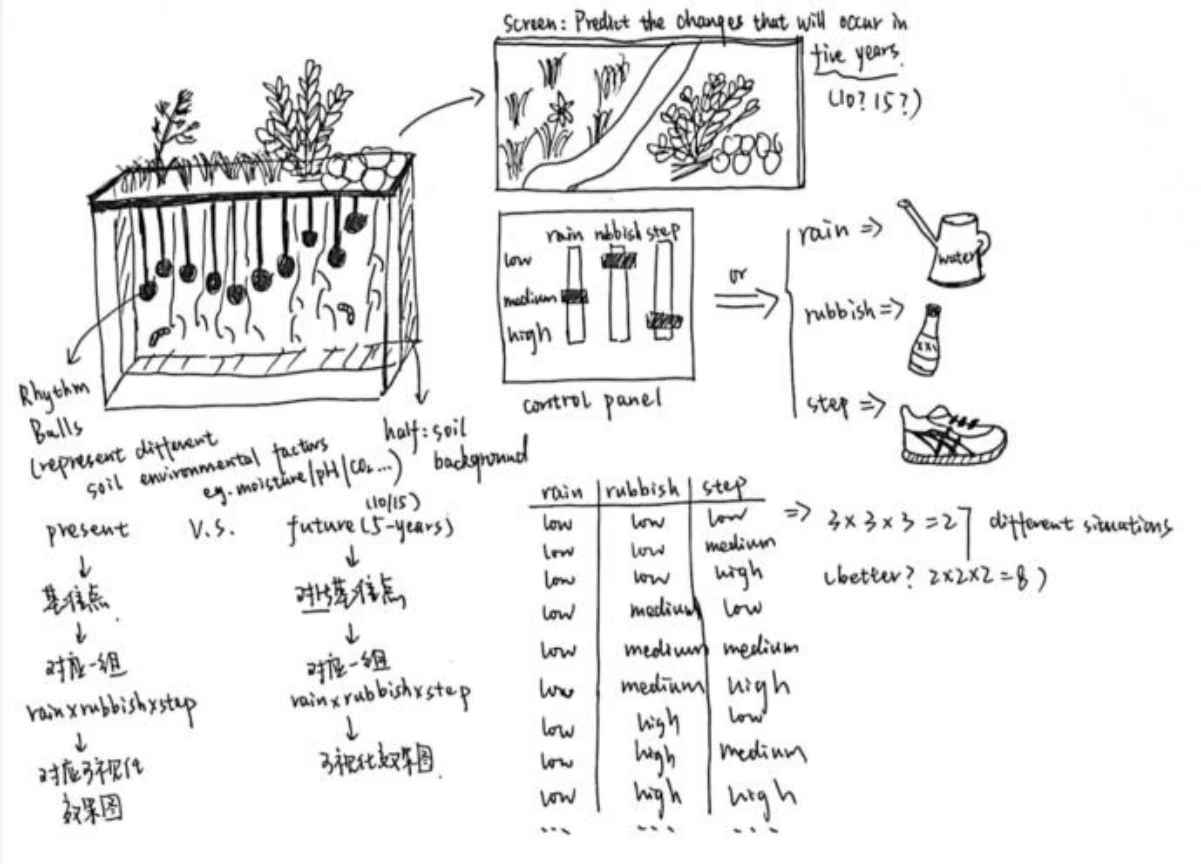
Make one relationship legible before representing the whole system.
- Layered underground model
- Suspended spheres
- Balancing scales
- Vertical hanging board
- Projected temporality
The decision
One pendulum. A clearer relationship.
Our early directions held too many variables and symbolic elements at once. Feedback and prototyping helped us concentrate on one magnetic pendulum: a focused mechanism that could remain readable while responding to changing conditions.
03 / Material & mechanism
Turning environmental data into a physical encounter.
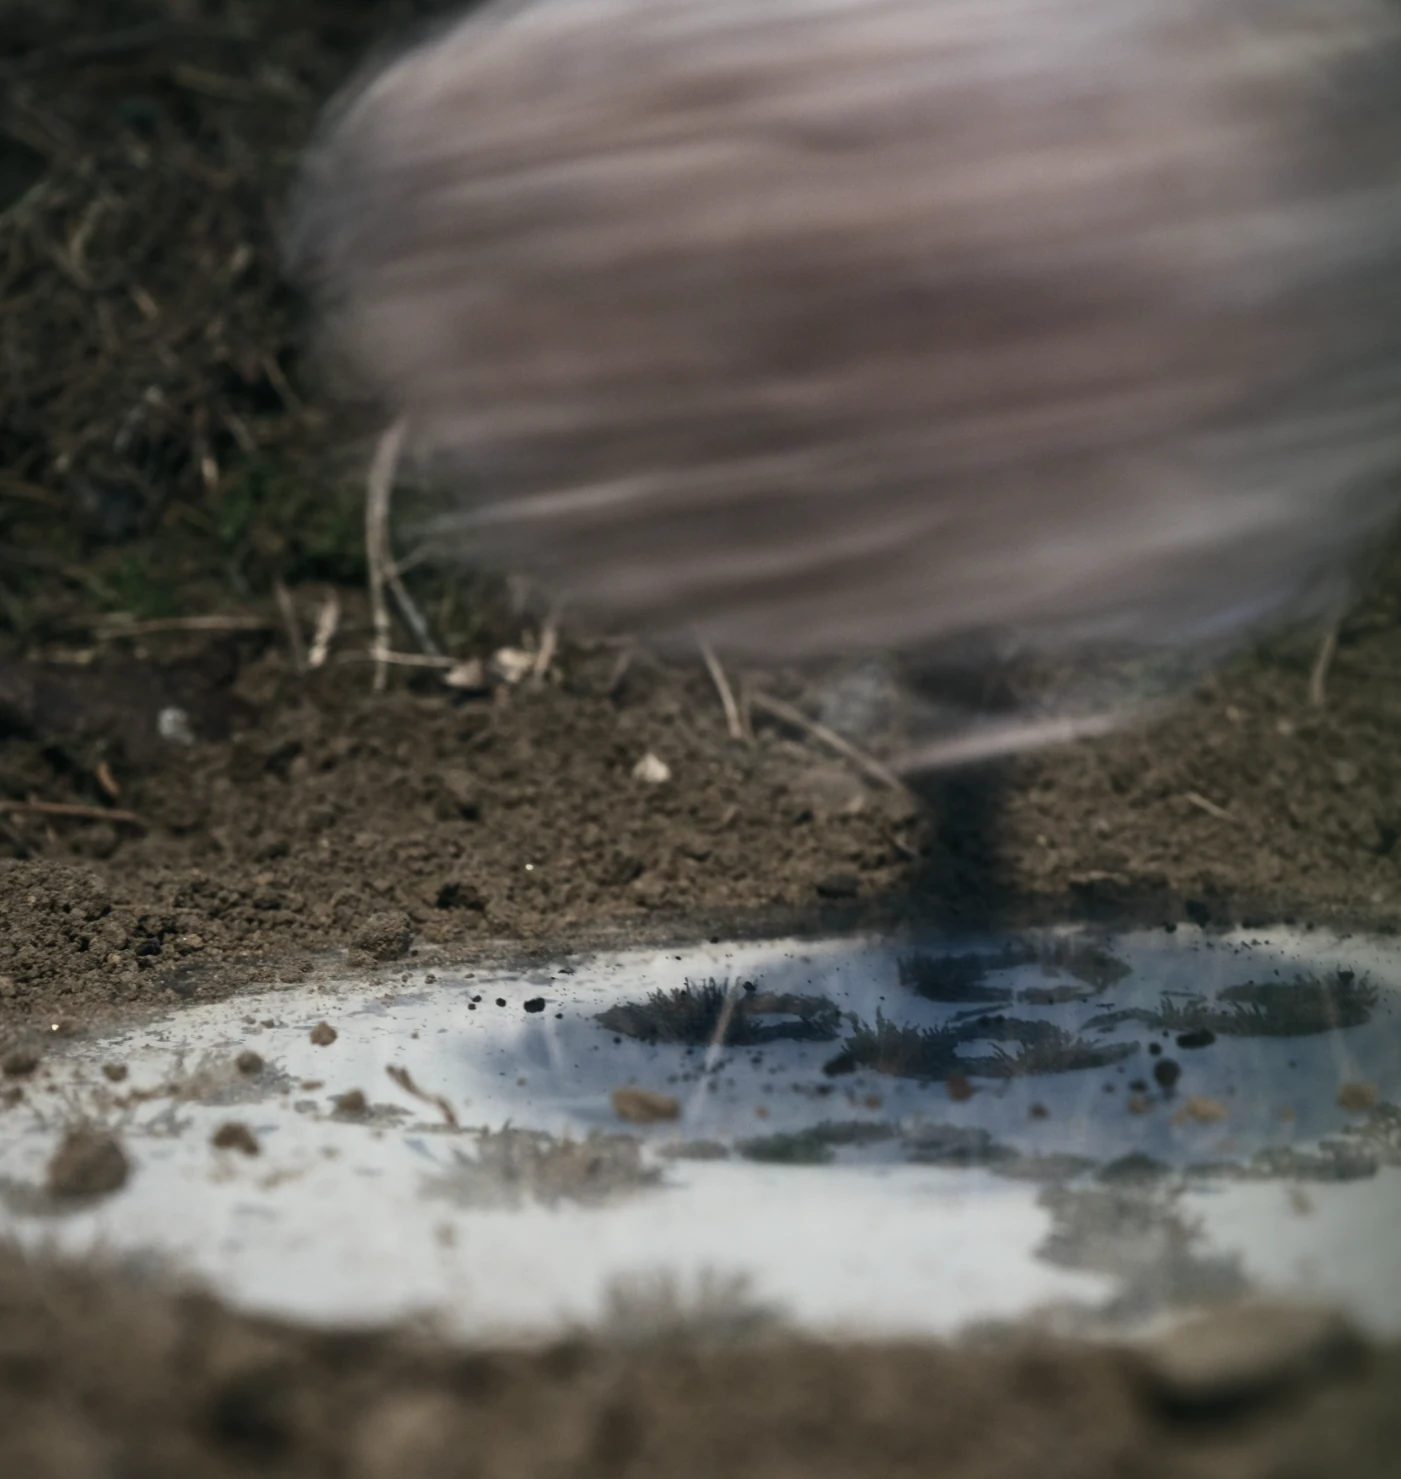
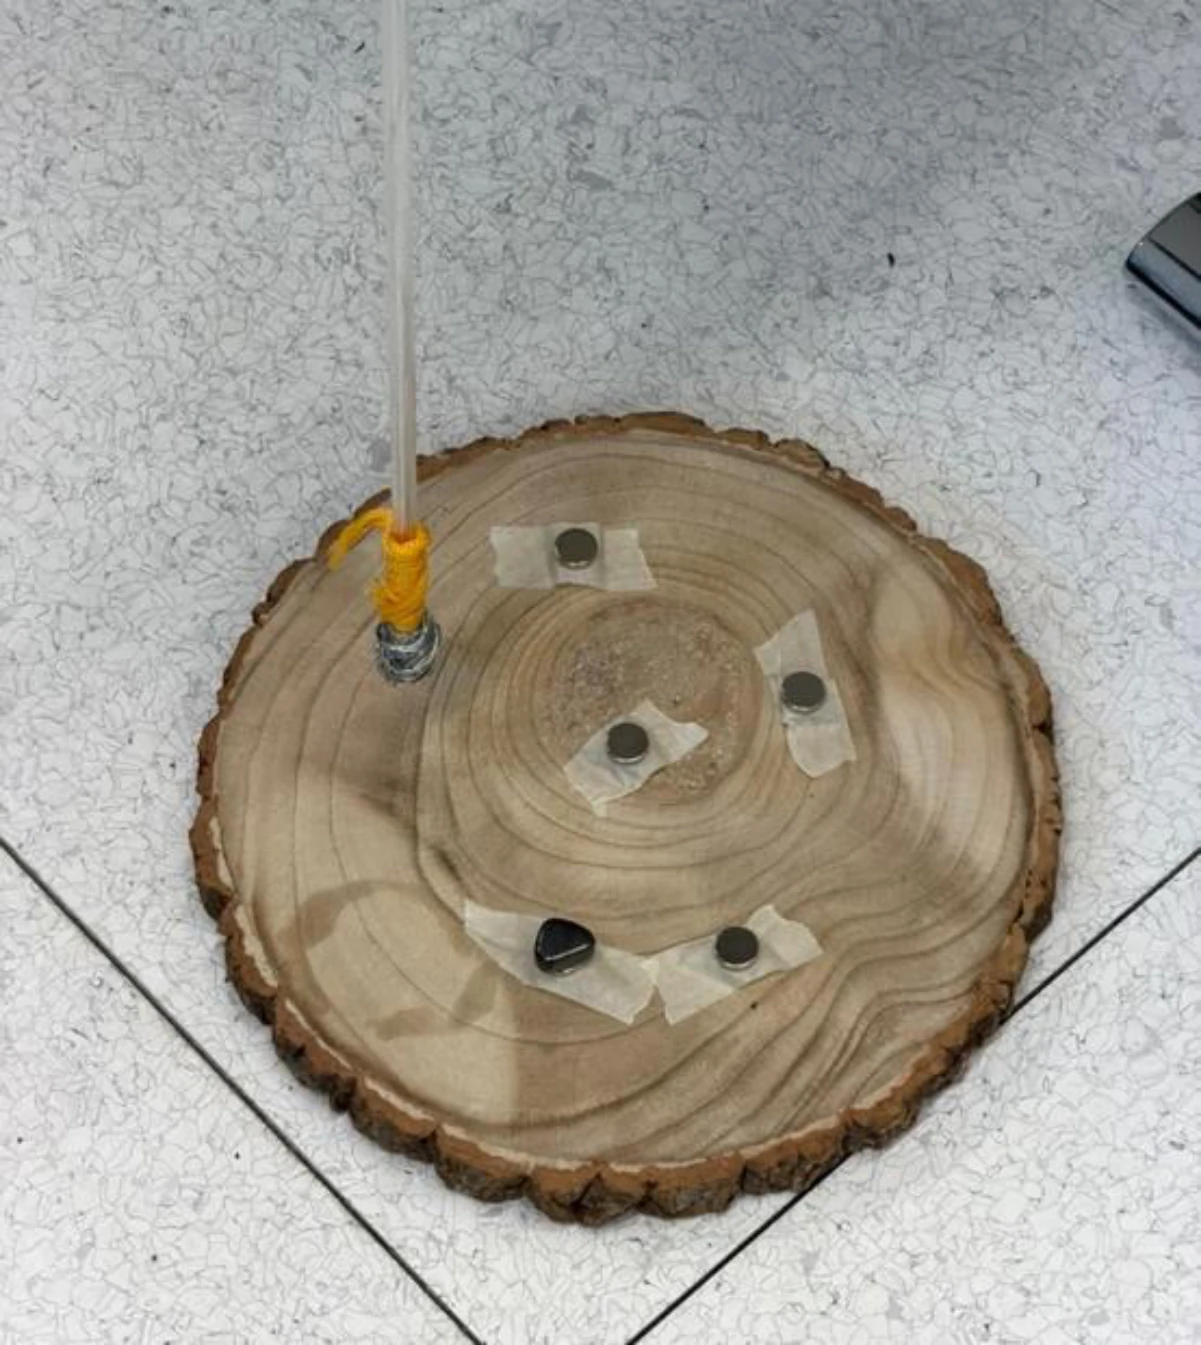
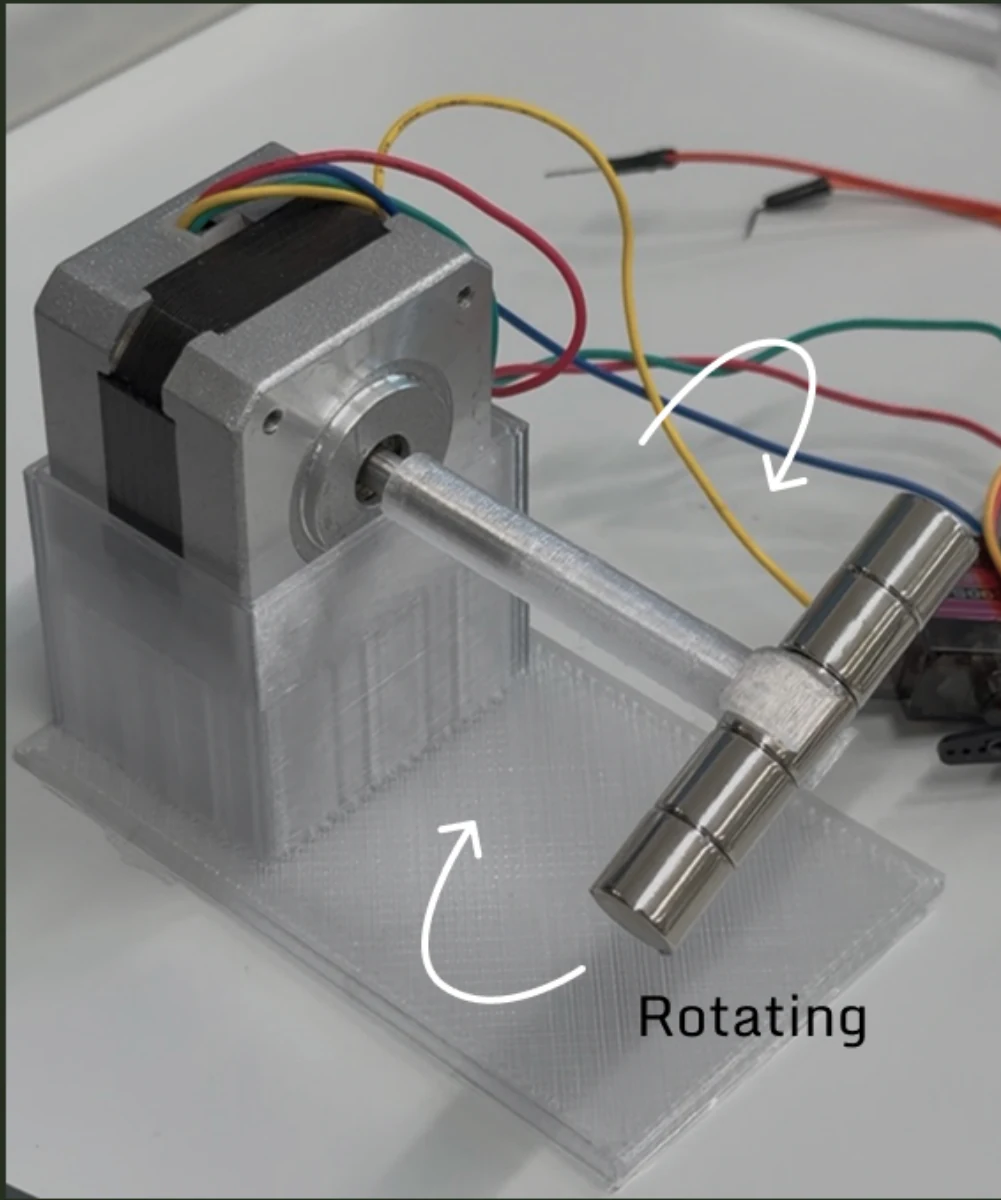
A permanent magnet inside the suspended form interacts with magnets near the plate. A hidden rotating magnet, driven by an Arduino-controlled motor, changes the forces acting on the pendulum.
Recorded rainfall provides a repeating temporal cycle. The plate and digital interface provide a complementary way to interpret selected soil conditions.
The physical rhythm
- Monthly rainfall records
- Arduino + rotating magnet
- Changing magnetic forces
- Pendulum motion
The digital interface explained the installation; it was not a live controller of the pendulum.
Pendulum
Movement makes hidden relationships tangible.
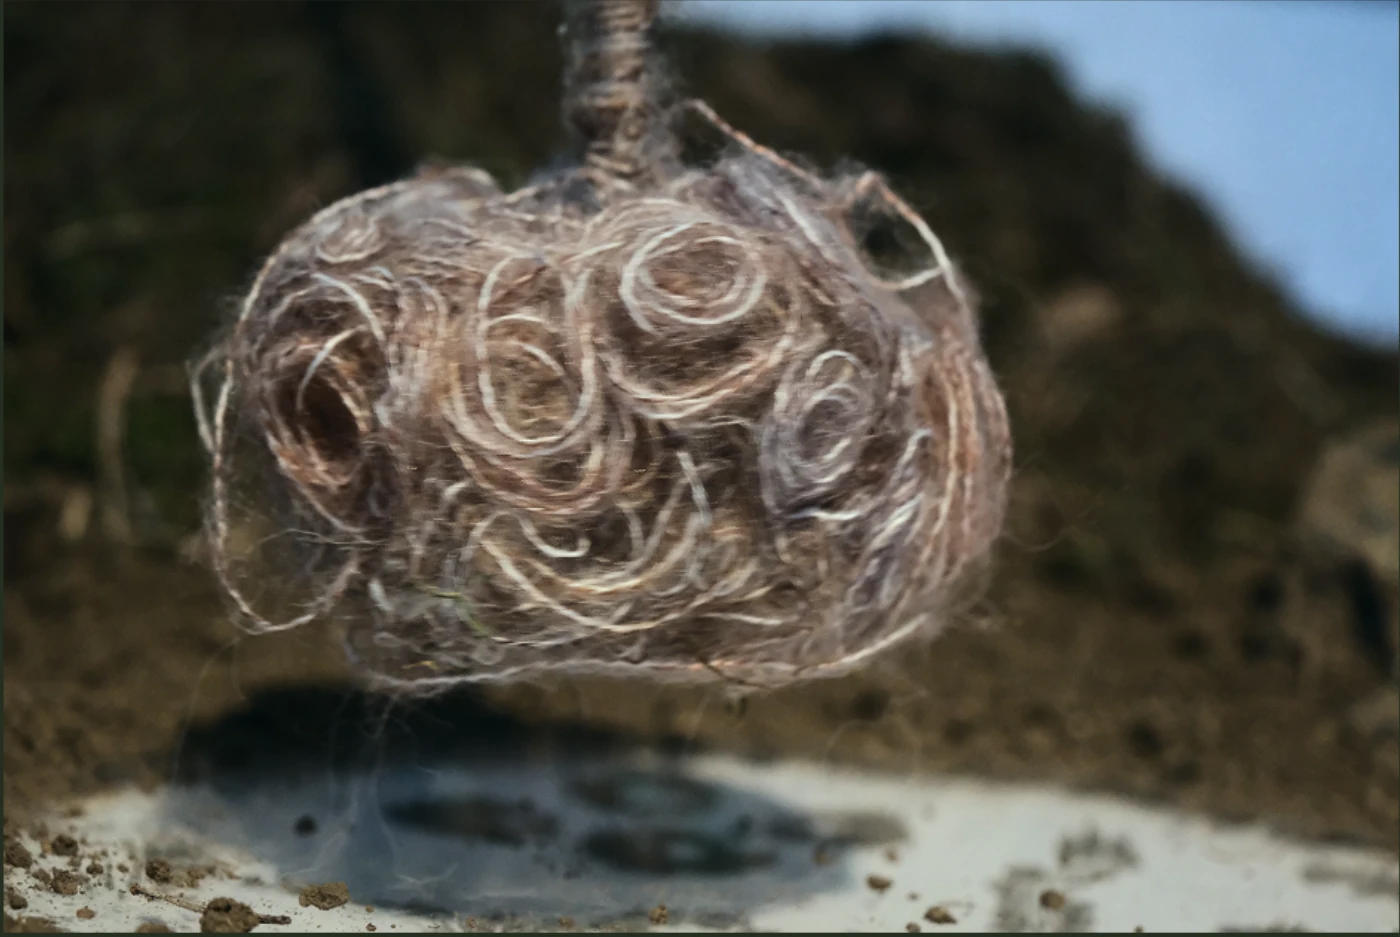
A tactile yarn form represents microbial life. Its internal magnet responds to surrounding magnetic forces, turning changing conditions into oscillation and deflection.
Magnetic plate
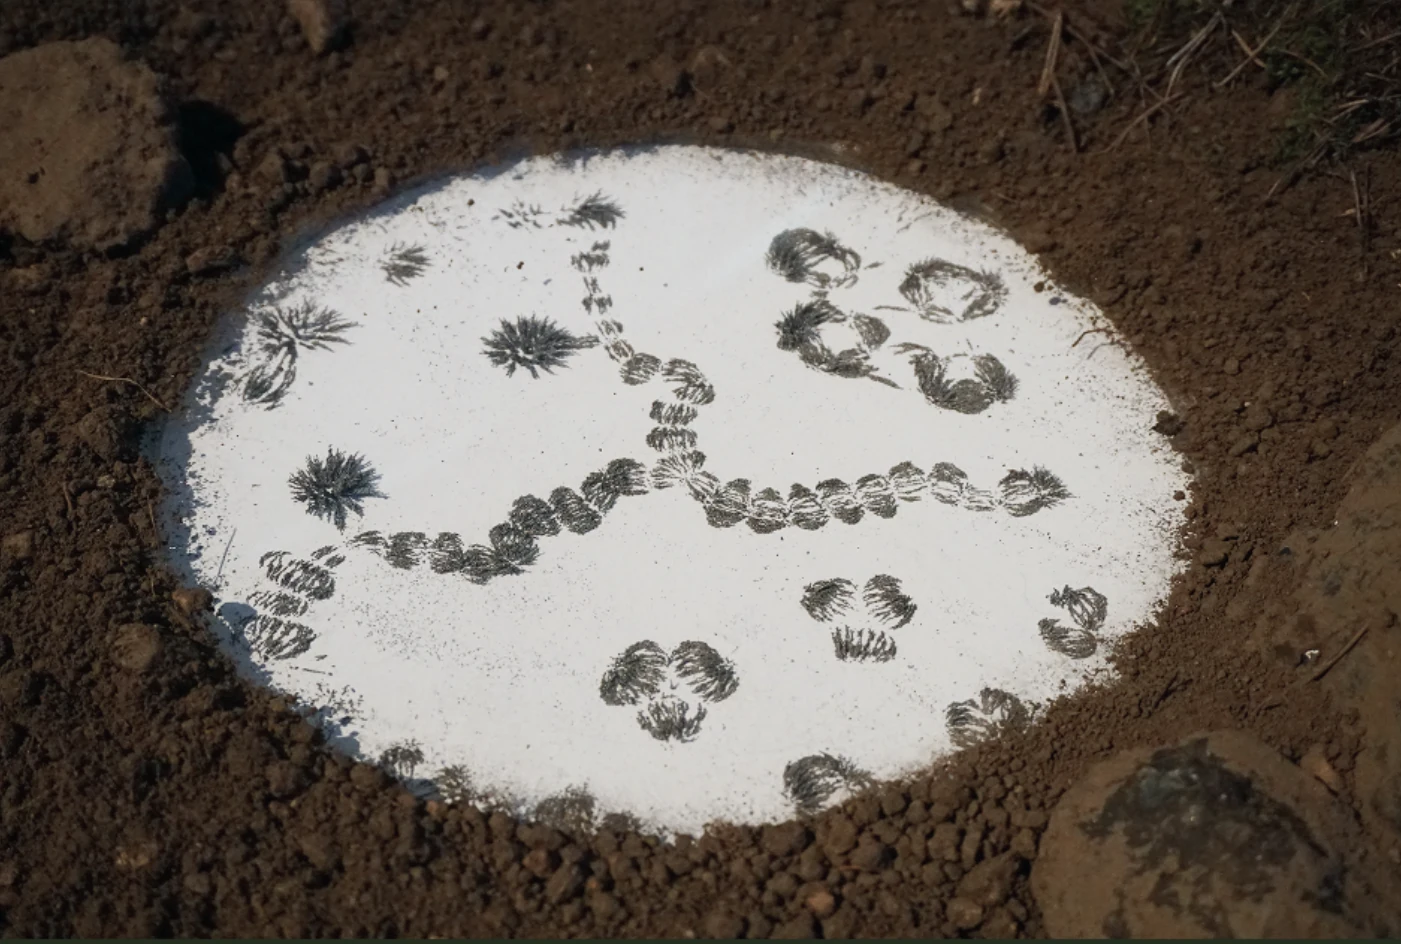
Invisible forces leave a visible trace.
Iron filings were chosen after exploring alternatives including ferrofluid and ink. Their patterns make magnetic relationships visible with manageable material and technical complexity.
Soil box
A recognisable landscape grounds the abstraction.
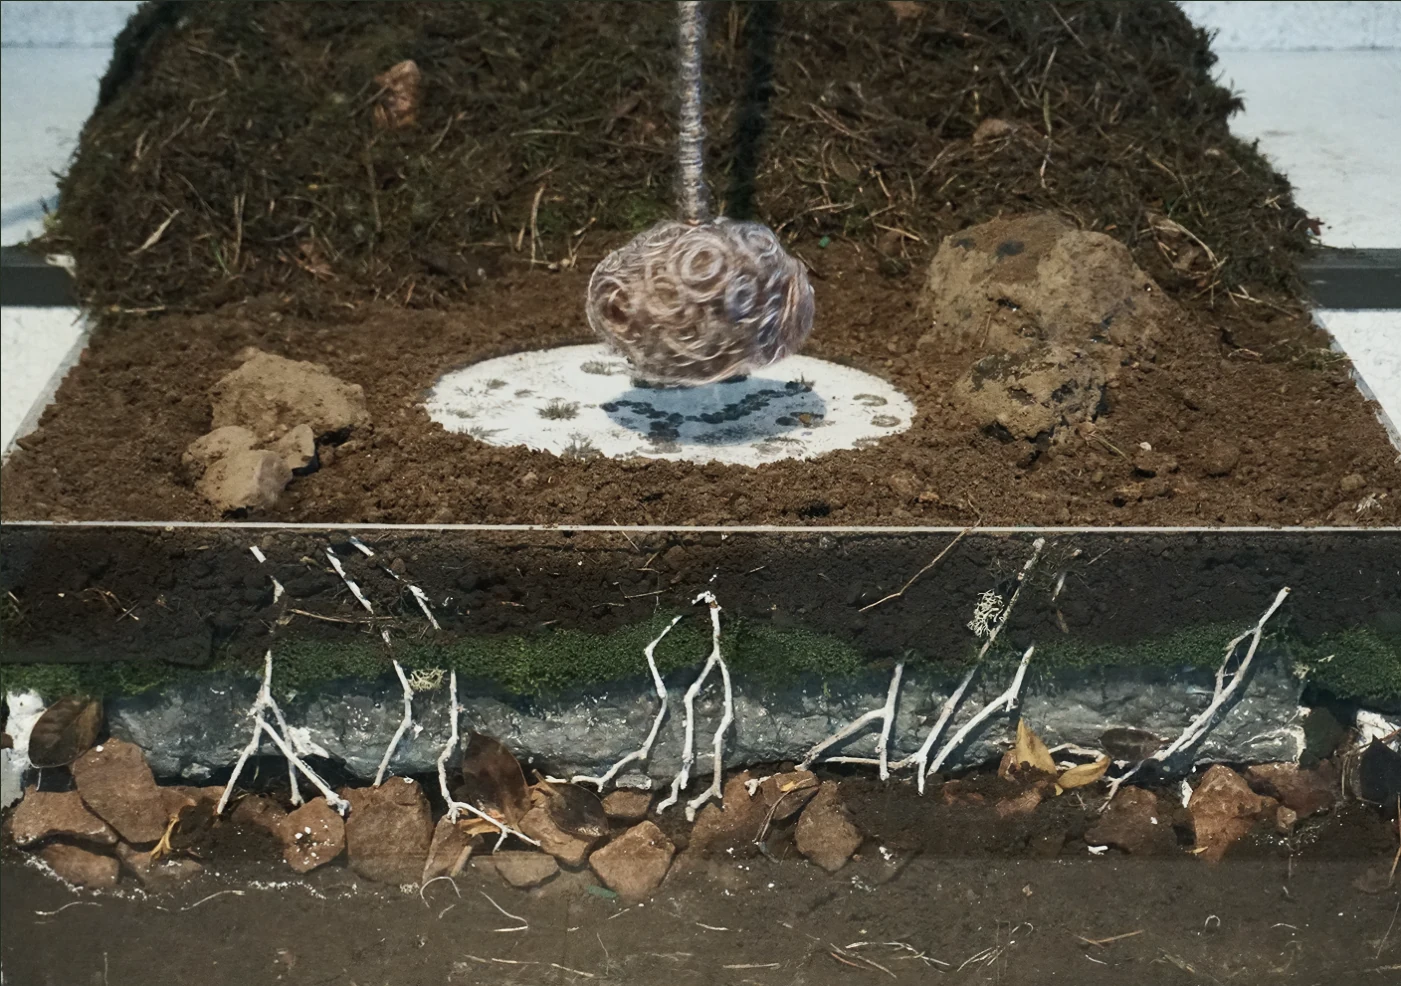
A transparent acrylic box exposes layers of soil, stones, roots and collected materials. The base becomes an underground cross-section, connecting the mechanism to the ecology it represents.
Digital interface
An explanation alongside the physical experience.
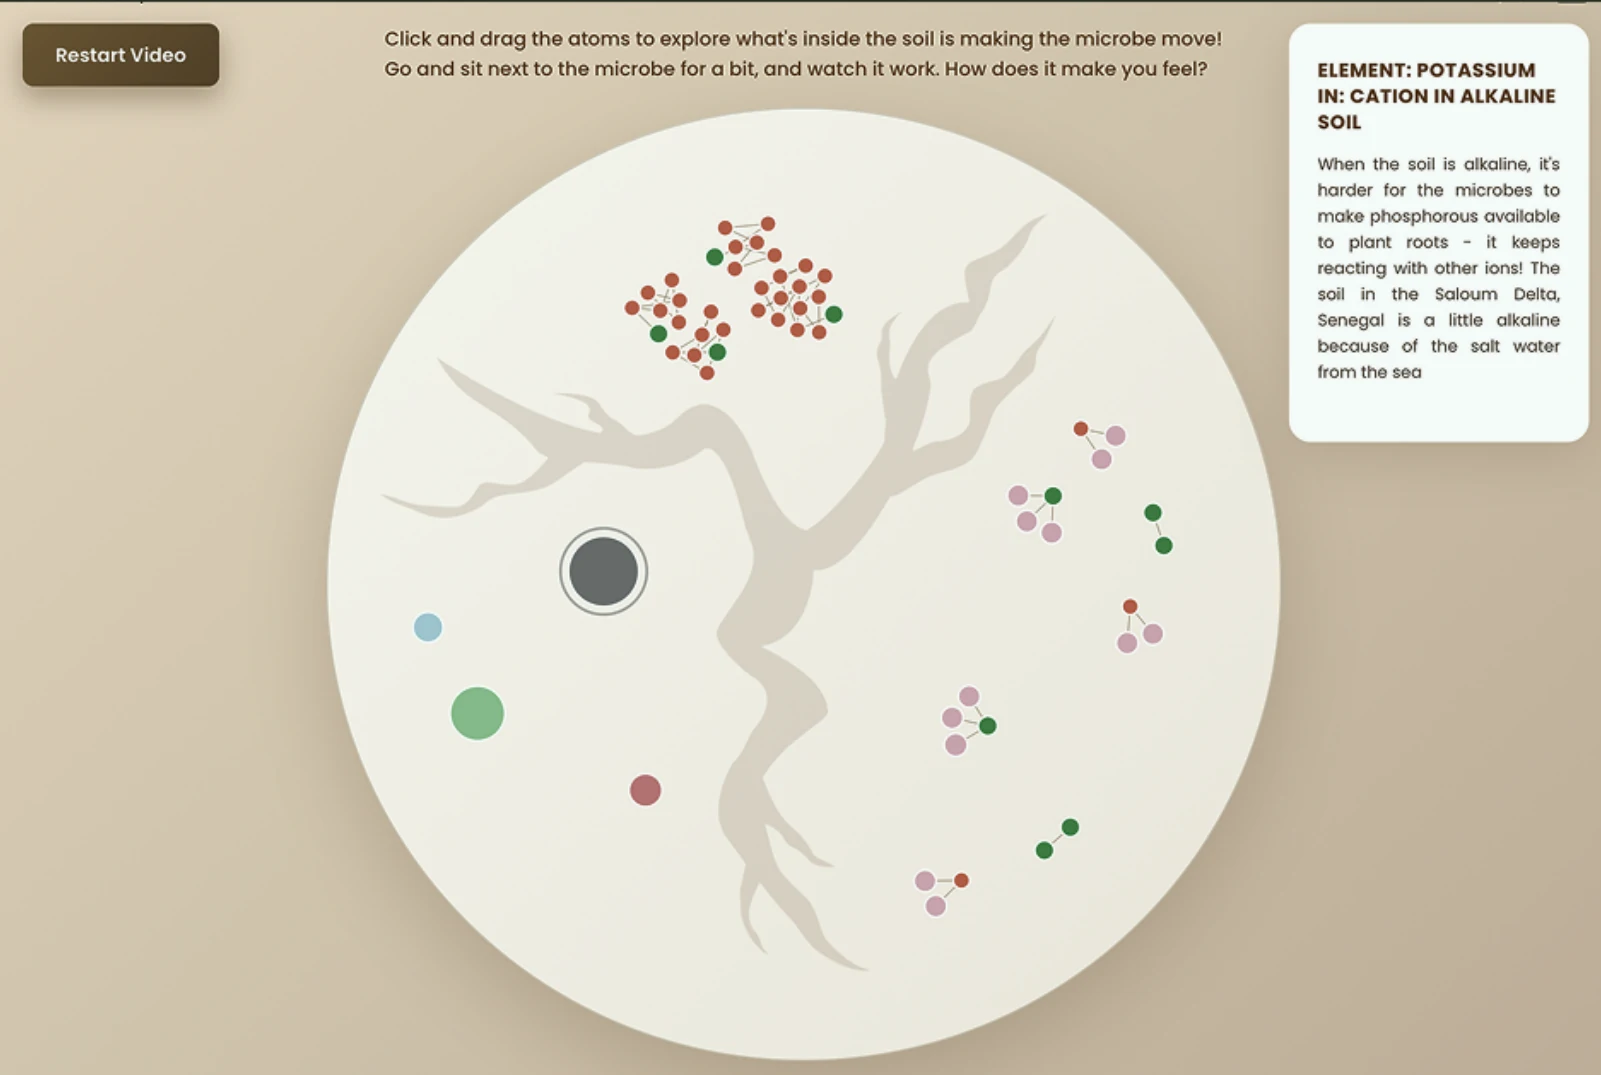
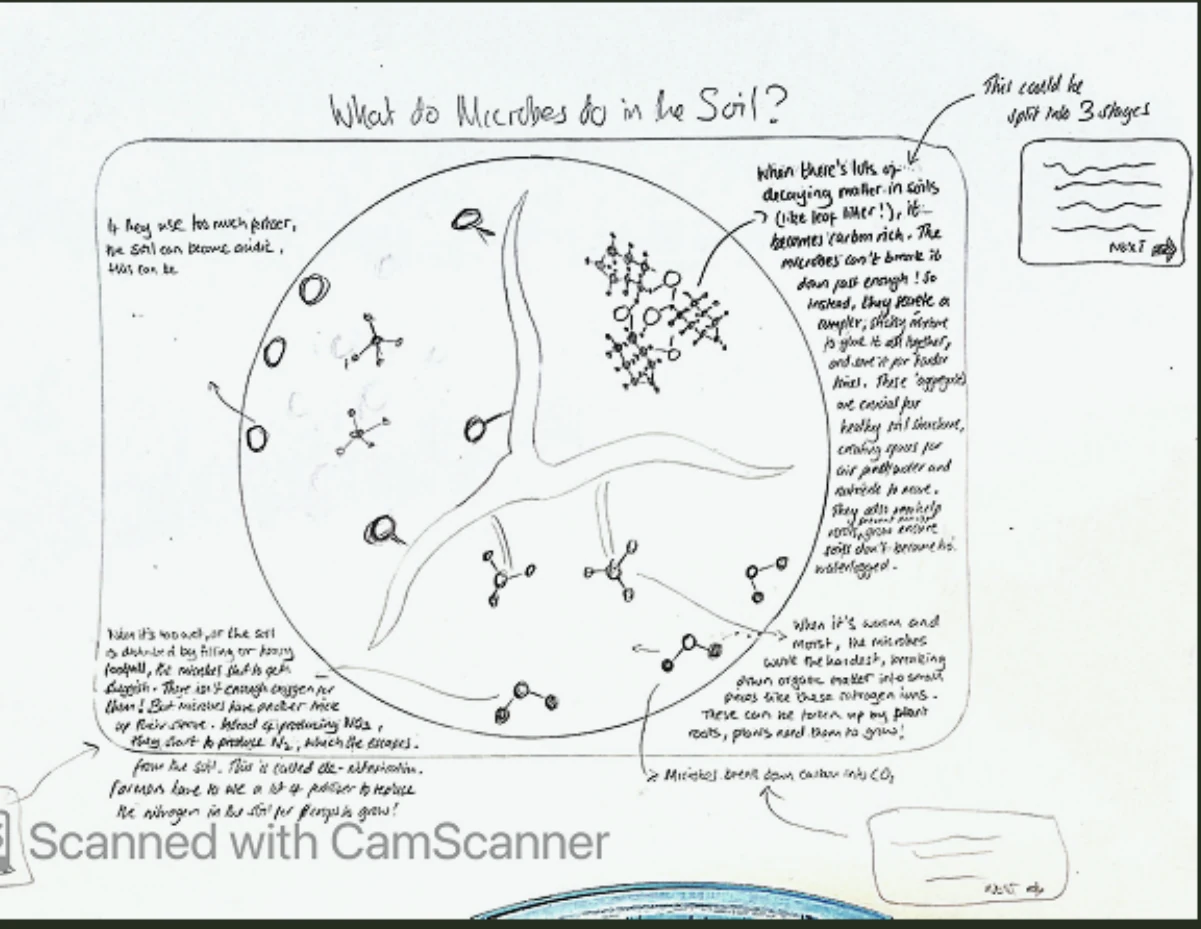
The circular interface echoes the plate’s root-like regions. Molecules, ions and short explanations help visitors connect an abstract material encounter to selected soil processes.
04 / Interface & experience
From fascination to understanding.
The interface became a visual translator.
Motion attracted attention, but its ecological meaning was not self-evident. The interface developed from a broad map-to-micro view towards a circular visual language aligned with the magnetic plate.
We used interface sketches to refine the connection between root-like regions, material patterns and short explanations. The final screen supported an interpretive encounter alongside the physical installation.

05 / Exhibition & reflection
The exhibition made the next design questions clearer.
A question heard at the exhibition
So… how does it work?!
Anonymous visitor, recorded in the project portfolio
The screen felt disconnected.
Some visitors did not immediately connect a screen positioned away from the installation to the physical work.
The starting point was easy to miss.
The replay control was not prominent enough, so visitors could miss the explanatory narrative.
Exploration looked like live control.
Dragging visual elements suggested control of the physical pendulum, even though that connection had not been implemented.
What I take forward
Working across several stages taught me to connect data choices, material experiments and audience interpretation. A compelling object still needs a clear invitation: what to notice, where to begin, and what an action actually changes.
The final installation was exhibited at InSpace in Edinburgh. Its observational feedback gives us concrete priorities for further development, rather than evidence of validated learning outcomes.
Exhibition / Designing Global Data InteractionsProject archive
Explore the evidence behind the case.
Team credits: Jiangzi Li · Millie Marriott Webb · Xiaoying Zhou · Xinran Fang · Xinyu Zhu